Mathematical and historical foundations of Extended Theories of Gravity (ETG)

A short paper, in english, on a fascinating development of General Relativity.

Abstract
Extended Theories of Gravity (ETG) represent a prominent framework in modern theoretical physics and cosmology, aimed at modifying or extending Albert Einstein’s General Relativity to address open phenomenological questions at both ultraviolet (early universe) and infrared (galactic and cosmological) scales.

pdf Brussi 2026 Mathematical and historical foundations of ETG (305 KB)

ETG

please, rate this post

Galactic Energy Profiles II

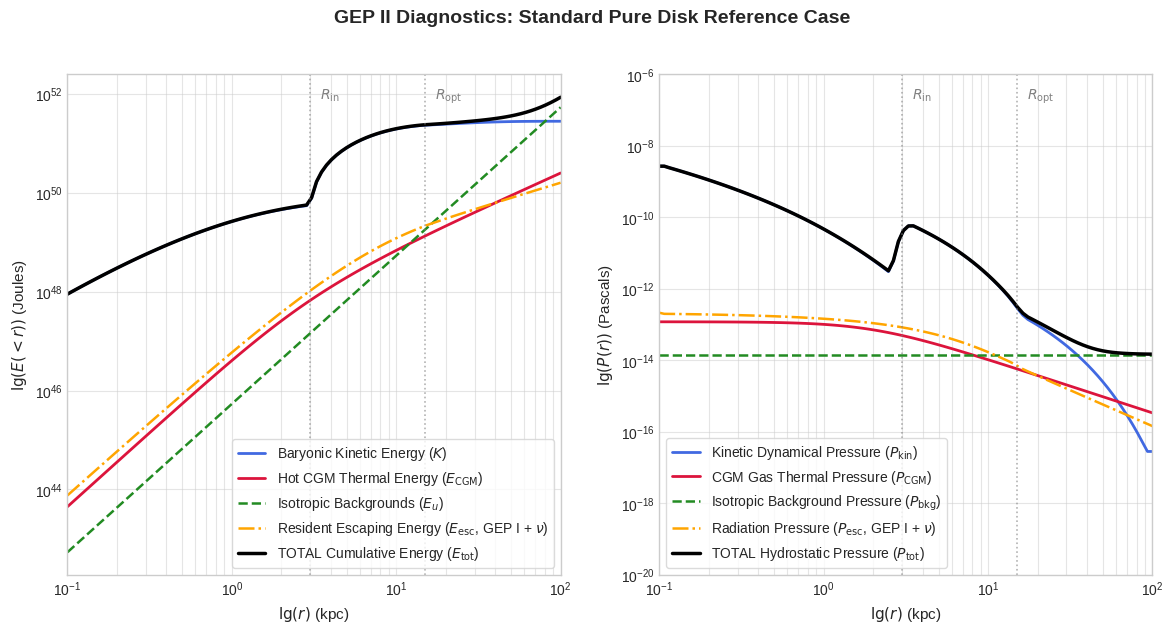
Galactic Energy Profiles: GEP II. In-System and Background Energy Densities

Update: I decided to publish this work, part of the GEP series, on Zenodo without peer review and to use it as a basic tool for building a subsequent dataset (GEP III). Note: This work is version 2.0 of the previous NAGE II work, which has been superseded.


Abstract
Standard galactic energy inventories typically focus on virialized components, namely kinetic and gravitational potential energy derived from baryonic mass distributions, together with energy inferred from bolometric luminosities. In the first paper of the Galactic Energy Profiles (GEP) series, we introduced a reproducible geometric framework for the radiant and relativistic fluxes of galactic origin, accounting for their finite escape time across the Halo. In this second work, we extend the framework toward a volumetric energy inventory, where bolometric luminosity is complemented by energy densities persistently present within the galactic volume. We consider the thermal and kinetic energy of baryonic matter—including bulk motions, turbulence, and rotational degrees of freedom from large-scale dynamics down to the intrinsic angular momentum of bound systems—together with cosmic rays confined by magnetic fields and extragalactic backgrounds (photons, neutrinos, and diffuse fields) permeating the Halo. This approach distinguishes between flux-based contributions and volume-based reservoirs, providing a complementary description of the total galactic energy budget. Crucially, by resolving these volumetric reservoirs into local radial profiles, we characterize the multi-component pressure support (including thermal, magnetic, cosmic ray, and radiant pressures) available to sustain the circumgalactic medium (CGM) in hydrostatic equilibrium. Although these components vary with morphology and evolutionary state, this study is purely theoretical and simplifies the extreme variability of galactic systems to derive reference estimates and ‘standard cases’. The resulting parametrized framework, supported by publicly available Python scripts, is intended as a further methodological baseline for the sample-wide application planned in later work.

Keywords
galactic energy inventory; galactic energy density; galactic Halo energy; energy distribution based on galactic morphology


Here is the Zenodo version of the paper (1.1 MB):

pdf Brussi 2026_GEP II


GEP_II

please, rate this post

Galactic Energy Profiles I

Galactic Energy Profiles: GEP I. Radiant and Relativistic Fluxes

Update: I decided to publish this work, part of the GEP series, on Zenodo without peer review and to use it as a basic tool for building a subsequent dataset (GEP III). Note: This work is version 2.0 of the previous NAGE I work, which has been superseded.


Abstract
Standard galactic energy inventories typically focus on the virialized components of the system, namely the kinetic and gravitational potential energy, derived from baryonic mass distributions and stellar luminosity. This paper, the first in the Galactic Energy Profiles series, introduces a reproducible geometric framework for accounting radiant and relativistic fluxes as a standing energy reservoir. By considering the photon and neutrino escape time τ across the galactic Halo, we quantify the energy density of radiation currently in transit as a component of the total galactic budget, complementary to the standard flux-based description. The resulting closed-form expressions, together with the accompanying open-source Python implementation, are intended as a calibrated methodological baseline for the subsequent application of this framework to observed galactic samples.

Keywords
galactic energy inventory; energy residence time; galactic radiant fluxes; galactic Halo energy; galaxy morphology


Here is the Zenodo version of the paper (1.1 MB):

pdf Brussi 2026 GEP I


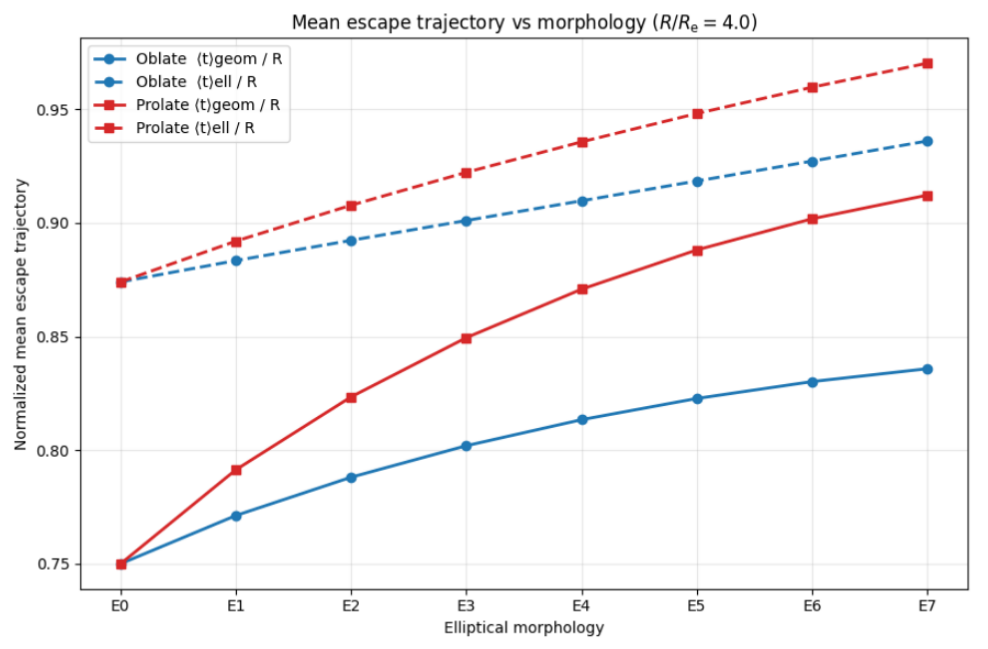
GEP I mean escape trajectory length

please, rate this post

The URD Framework – under development

The URD Framework: Cosmological Distances from Redshift in a Non-Standard Context

While I am still developing the project —including through parallel studies on the Tolman test and the quality of indirect data obtained from recent galaxy surveys— I am making my work public as a preprint. I always hope that someone might be interested in my conjectures or perhaps even willing to collaborate with me to address the critical issues of the URD Framework.


Abstract
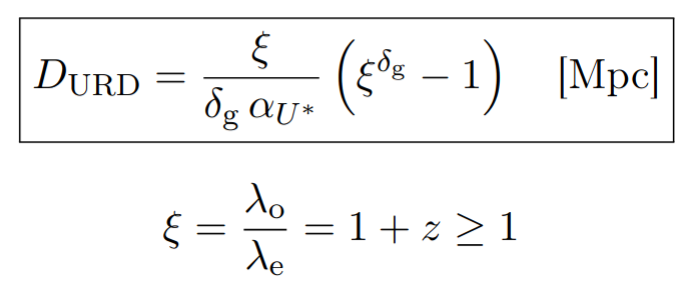
A phenomenological framework for determining cosmological distances is proposed, based on a non-expanding spacetime interpretation consistent with current observational datasets. The model introduces a redshift mechanism associated with cumulative photon energy attenuation along the line of sight, formulated in a way that is not equivalent to standard tired light scenarios. The approach is constructed to remain compatible with established relativistic principles whereas adopting boundary conditions distinct from the metric expansion paradigm. Distance estimation is achieved through the URD equation (U energy density, Redshift, Distance), which incorporates two phenomenological parameters that describe conformal geometric dissipation in extended gravity and an effective relativistic path-length correction. Within this formulation, the model addresses the primary shortcomings traditionally associated with energy dissipation effects, specifically reconciling time dilation in supernova light curves and the Tolman surface brightness relation. The model is calibrated using the Pantheon+ supernova sample by comparing and cross-validating distances inferred from the proposed redshift mapping with redshift-independent indicators, with additional comparison performed against baryon acoustic oscillations, radio galaxy samples, and high-energy quasars. Across these datasets, the framework reproduces observational constraints over a wide redshift range within a phenomenological, non-standard cosmological setting. The results indicate that alternative, non-expansion-based mappings between redshift and distance can be constructed that remain consistent within the observational range considered, suggesting a phenomenological alternative worth further study.
Keywords
cosmological distance ladder; redshift-distance relation; non-expanding spacetime; cosmic microwave background; extended gravity; Pantheon+ sample; baryon acoustic oscillations; Tolman test; time dilation; geodetic correction


Here is the last version of the preprint (5.1 MB):

pdf Brussi 2026_URD Framework Preprint

Version uploaded to Zenodo:

link DOI – zenodo.20763682


URD distance formula

please, rate this post

Understanding the Sizes : 4 – galaxy clusters and beyond

Exploring beyond our galaxy, to be able to reach the edges of the known universe with measurements that can be perceived, it is necessary to change scale again compared with the previous post on the Milky Way. Over there, the distances involved become almost impossible to truly understand, they are so mindblowing!

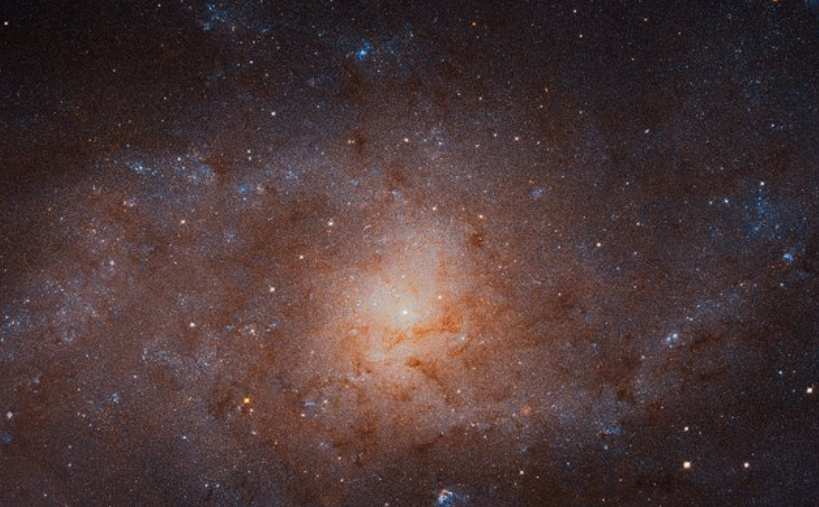
Let us now consider our galaxy to be 1 millimeter across. We are part of a ‘local’ group of galaxies made up of more than a hundred smaller galaxies (of which only one is of significant size, the Triangulum Galaxy, known as M33, see Figure 1), and a large spiral galaxy broadly similar to ours, Andromeda (Figure 2), which is about 2.5 cm away. Andromeda is the most distant cosmological object that can be seen with the naked eye (see also my post References for laymen: angles in the sky).


Figure 1 – triangle galaxy M33 (credits: Nasa, Esa e M. Durbin, J. Dalcanton e B. F. Williams, University of Washington)
Triangle galaxy M33


Figure 2 – Andromeda galaxy (image credit: Westend61 via Getty Images)

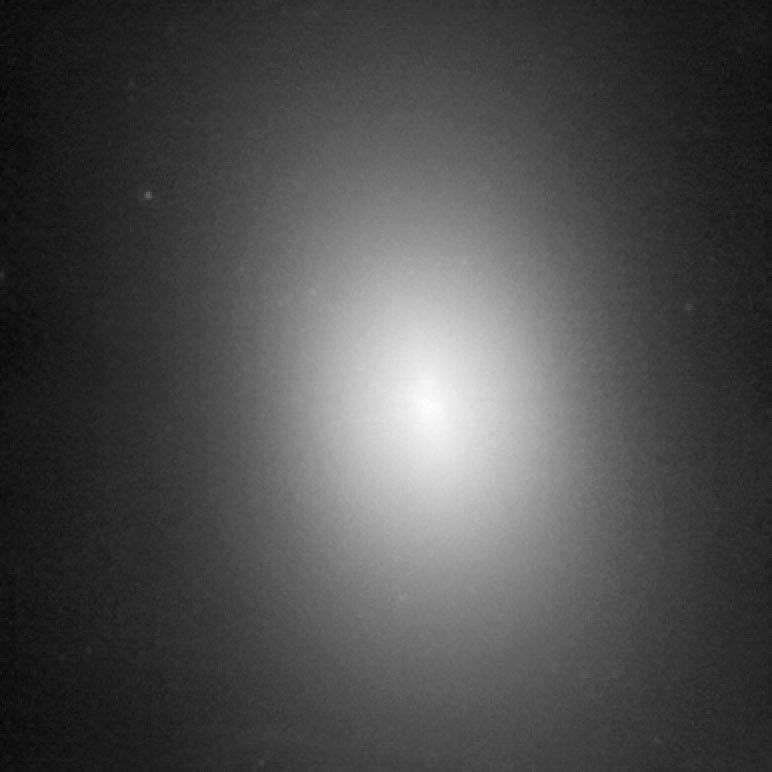
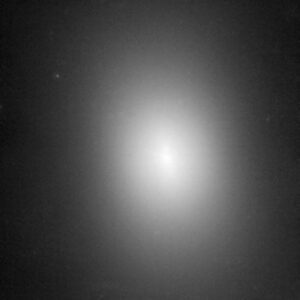
Andromeda is more extended but less massive than our galaxy. It’s getting closer to us (or rather we’re getting closer to each other) at about 400,000 km/h, on our new scale, less than four thousandths of a millimeter (about one hundredth the thickness of a hair) in a million years. In other words, in 4–5 billion years the two galaxies will merge, still in a collisionless way (we demonstrated this here, §1, not for newbies), and will probably turn into a giant elliptical galaxy (like NGC 1600 in Figure 3) after a few more billion years. However, recent measurements from the Gaia* satellite reduce the probability of this merger happening on such ‘short’ timescales, even though it is inevitable that it will occur.

* The Gaia satellite is an astrometric mission of the European Space Agency (ESA), launched in 2013 to map the Milky Way in 3D. It orbits around the Lagrange point L2 (see my post The three-body problem and the five Lagrangian points), and has created the most precise stellar catalog of more than 2 billion stars around us, measuring their positions, motions, brightness, and chemical composition.


Figure 3 – NGC 1600 by HST, it has a diameter of about 120.000 light -years, or about 1.2 mm on our scale (credits: A. Quillen, University of Rochester, G. Bower, CSC/STScI, and G. Rieke, Steward Observatory/University of Arizona)
NGC 1600


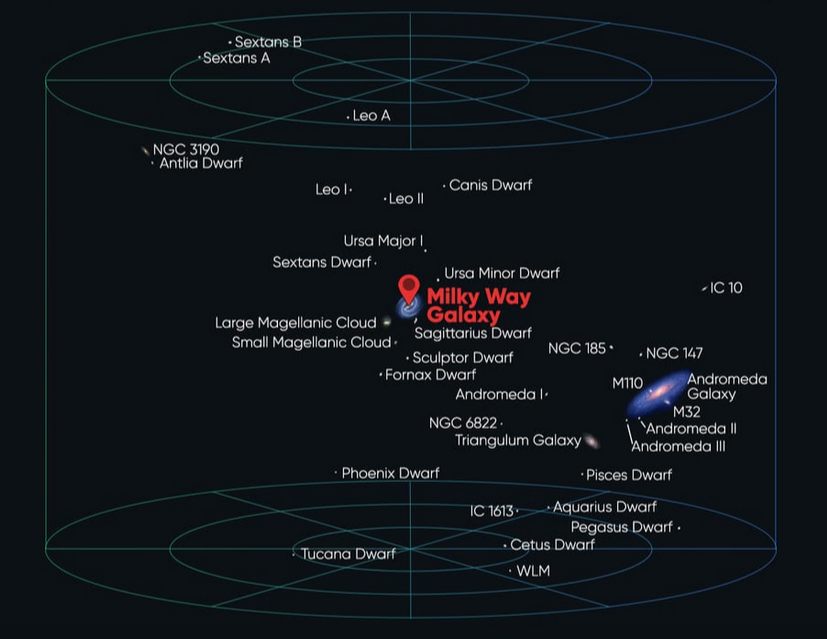
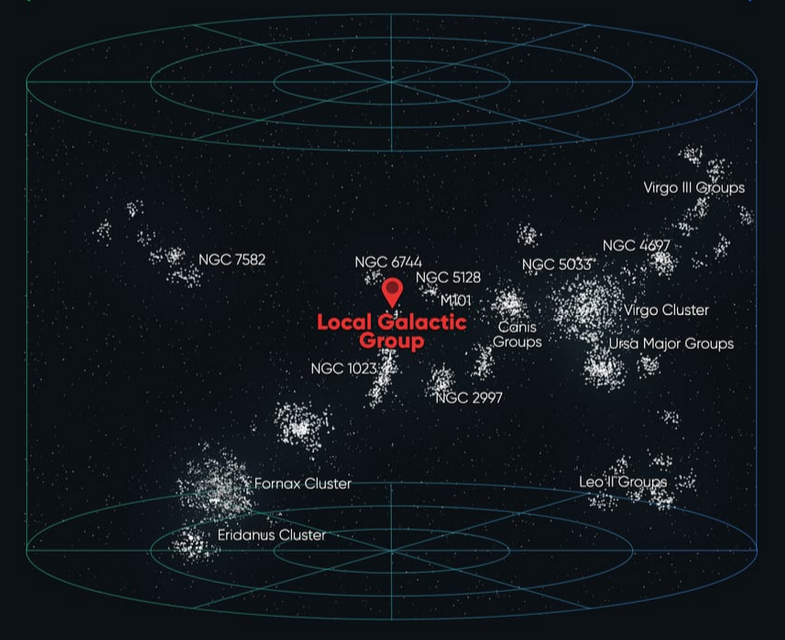
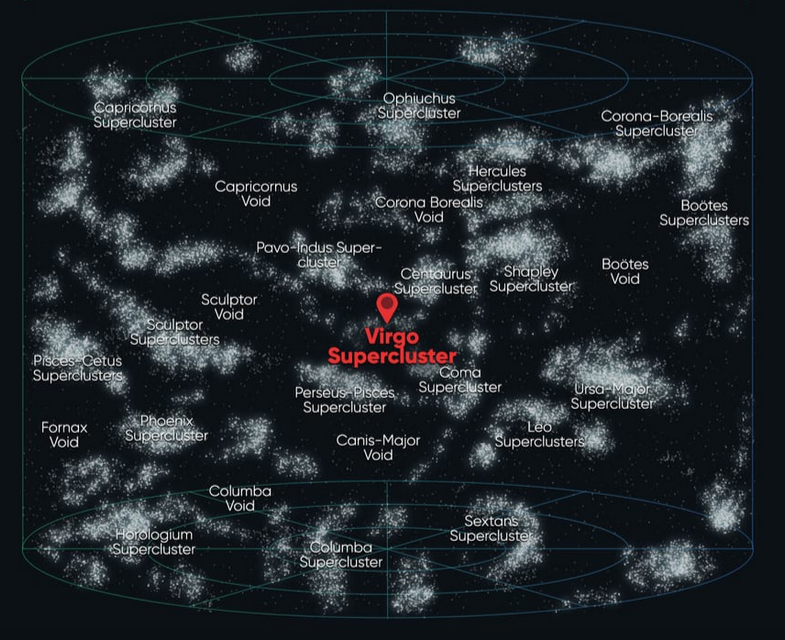
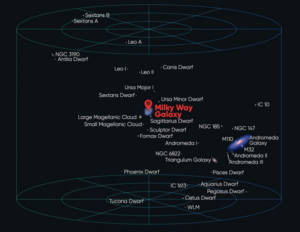
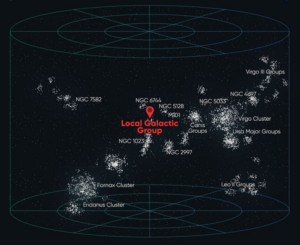
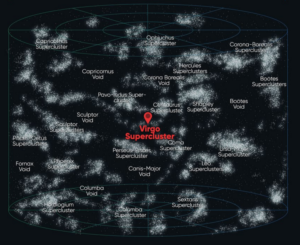
The Local Group of galaxies (see the 3D schematic in Figure 4) has a radius of about 3 cm on the adopted scale, and is surrounded in an “homogeneous” way by similar structures. For example, in Figure 5 a radius of 33 cm is considered on the same scale, and in Figure 6 a radius of about 1.5 m. Proceeding in an analogous way, one can reach the limit of the observable universe (that is, before redshift completely prevents sources from being detected) which, on the adopted scale, can be taken to be at a distance of just over 4 meters.


Figure 4 – Local Group of galaxies (source starwalk.space)
local galaxies cluster


Figure 5 – Virgo Supercluster, along with 100 other galaxy groups (source starwalk.space)
Virgo Supercluster


Figure 6 – Laniakea Supercluster which includes almost 100.000 galaxies more than ours (source starwalk.space)
Super Supercluster


We have reached the limit of the current theory of the standard cosmological model. It is a theory, based on creation from nothing through an initial Big Bang, which is strongly supported by observations but also has major gaps in explaining other evidence.
Our journey therefore stops right at the limit of ‘measurable’ findings grounded in commonly accepted theories; beyond this point, it becomes epistemology rather than cosmology.


Previous episodes:
Understanding the Sizes : 3 – Milky Way
Understanding the Sizes : 2 – Solar System
Understanding the Sizes : 1 – Earth and Moon

please, rate this post

Understanding the Sizes : 3 – Milky Way

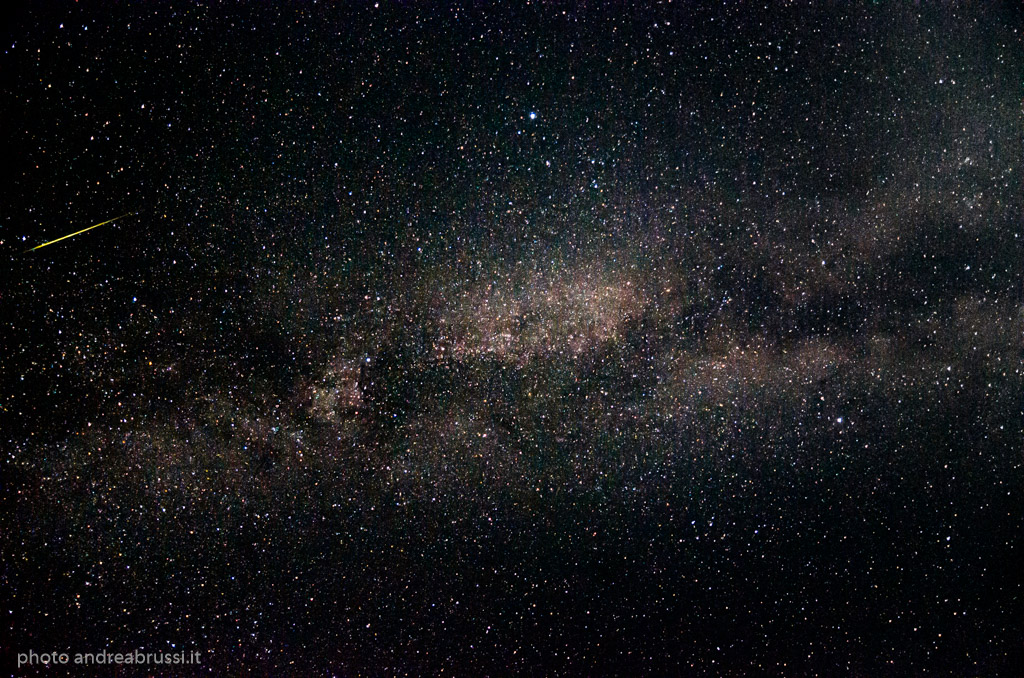
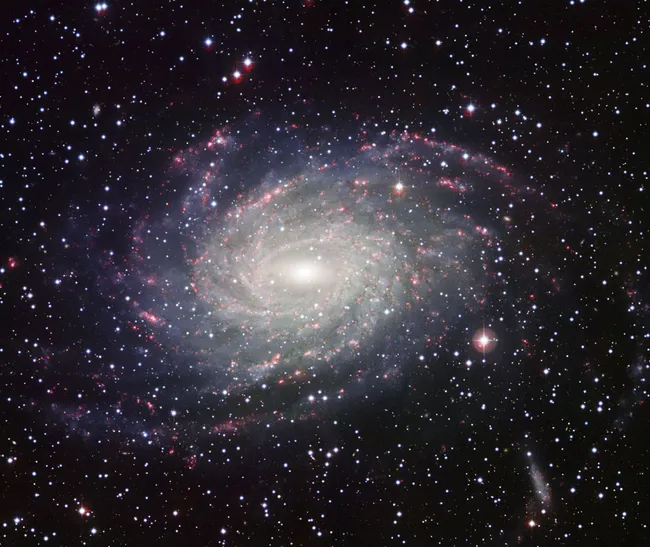
The Milky Way is our galaxy: a gravitationally bound structure that includes about 100 billion stars and an enormous amount of gas (essentially atomic hydrogen), with an approximate shape of a rotating disk, which, of course, we can only imagine and not actually see, since we are inside it (our view towards the galactic centre is known, see Figure 1, even if it is increasingly difficult to observe, due to atmospheric pollution, especially light pollution.). See Figure 2 for a photo of a similar example. The stars, gas, and dust that make up the disk rotate in the sense that they orbit around the roughly spherical central nucleus (the bulge), which instead is not rotating (its stars have chaotic motions).


Figure 1 -Milky Way as seen from Earth (my photo)

Milky Way


Figure 2 – example of a galaxy similar to the Milky Way: NGC 6744, taken at the European Southern Observatory’s La Silla Observatory in Chile (image credits: ESO)

Galaxy like Milky Way


To understand the sizes, it is necessary to change scale again compared with the previous post on the Solar System: the quantities involved become increasingly difficult to ‘grasp’. We have seen that Sun light takes about 4 hours to reach Neptune, the outermost planet of the Solar System. The star closest to us is Proxima Centauri (a red dwarf in a triple star system), about 4 light-years away. We therefore choose the light-year as the unit for this new distance scale, imagining 1 light-year as equal to 1 millimeter. Then Proxima Centauri is about 4 mm from the Sun (of course, since the difference is only a few light-minutes compared with 4 light-years, Earth and the Sun that Earth orbits can be considered at essentially the same distance).

All these stars orbit around the nucleus but also have their own independent motions, which are collisionless (we demonstrated this here, §1, not for newbies), a remarkable fact given the number of bodies, and in contrast, for example, with a collection of gas molecules in a container, which instead undergo continuous collisions (which determine its pressure and temperature). But compared with a gas, the distances between the components in a galaxy are immensely larger.

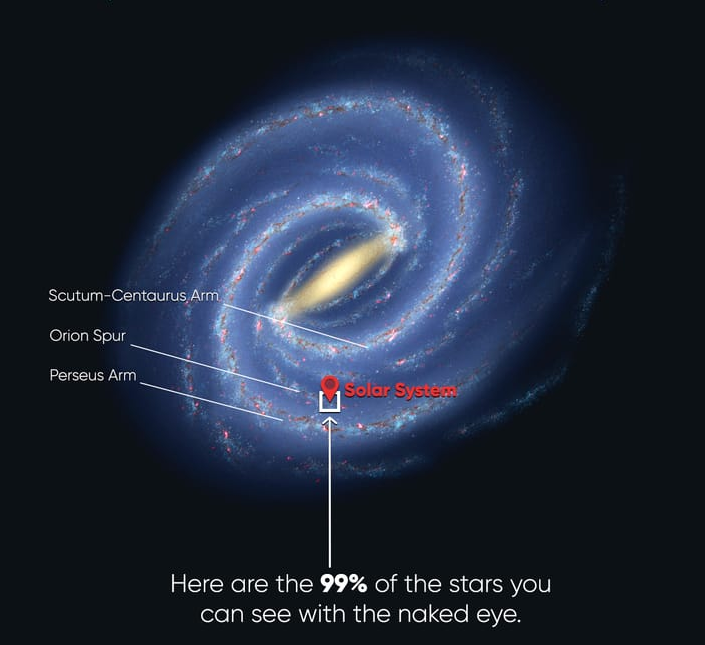
In the new scale we have adopted, the radius of the galactic disk is about 105 meters (about 105,000 light-years), and our position is about 26 meters from the center. In Figure 3 the drawing schematically outlines one possible configuration and the proportions. Our linear speed is about 790,000 km/h and we complete one orbit in about 250 million years, so on our scale, despite the crazy speed, we move only about 1.5 cm in a thousand years, in this 105-meter-radius disk. Since the Sun and Earth formed, about 4.5 billion years ago, we have made about 18 revolutions around the galactic nucleus.


Figure 3 – schematic drawing of the Milky Way and its proportions (gases beyond the star limit are not drawn but they are gravitationally relevant; source starwalk.space)

MIlky Way sketch


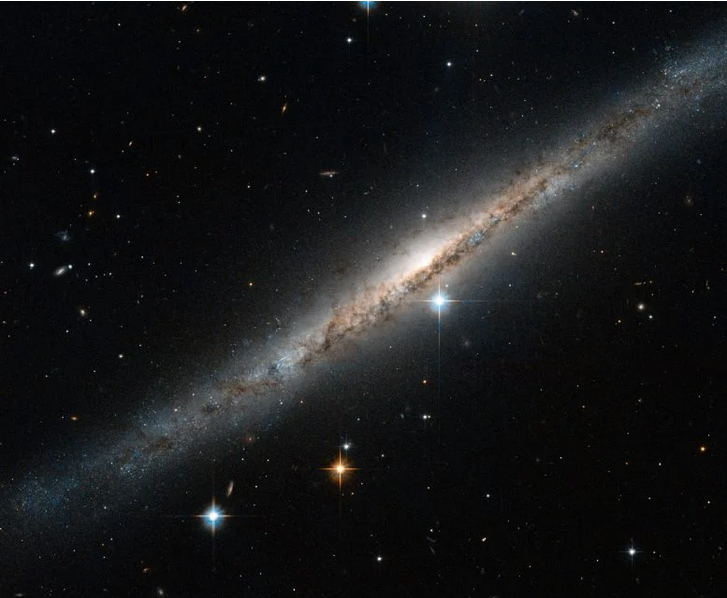
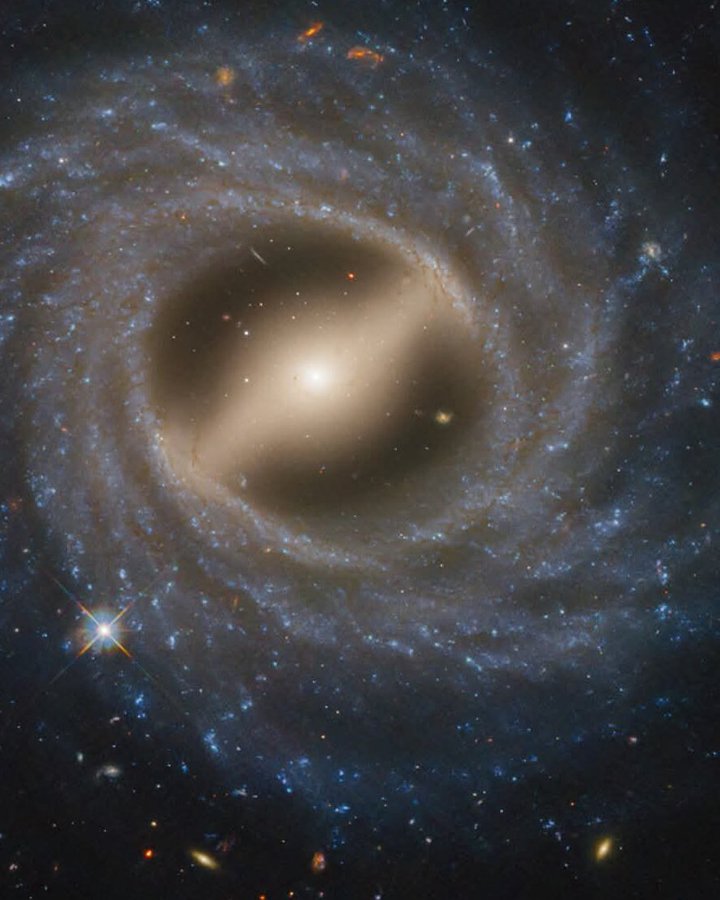
The disk of our galaxy is made up of several arms, where the concentration of stars is higher, and a more rectilinear component that originates from the central nucleus, from which the arms branch out, as schematized in Figure 3. A galaxy of this kind is called a ‘barred spiral’ and its shape when seen edge-on is similar to the example in Figure 4.
In a future post we will talk about the central black hole and the star-forming regions.


Figure 4 – Example of a spiral galaxy seen edge-on, ESO 121-6 (source: HST by ESA/Hubble & NASA)

Galaxy edge on Eso121-6


As a final remark, note that nearly all the stars visible to the naked eye belong to the Sun’s local stellar neighborhood, as highlighted in Figure 3. It’s a tiny region compared with the size of the whole Milky Way. Most of the Galaxy’s other stars are too faint and/or too obscured by interstellar dust to be seen individually, and instead contribute to the Milky Way’s diffuse glow: a blend of millions to billions of unresolved stars.


Next episode:
Understanding the Sizes : 4 – galaxy clusters and beyond

Previous episodes:
Understanding the Sizes : 2 – Solar System
Understanding the Sizes : 1 – Earth and Moon

please, rate this post

References for laymen: angles in the sky

The positions and the sizes of cosmological objects observed as projected onto a background sphere are measured in degrees, starting from reference orientations. This brief note aims to highlight the observational ‘measurements’ of certain cosmological objects, measurements that are rarely taken into consideration.
We imagine a simple observation of the night sky with the naked eye…

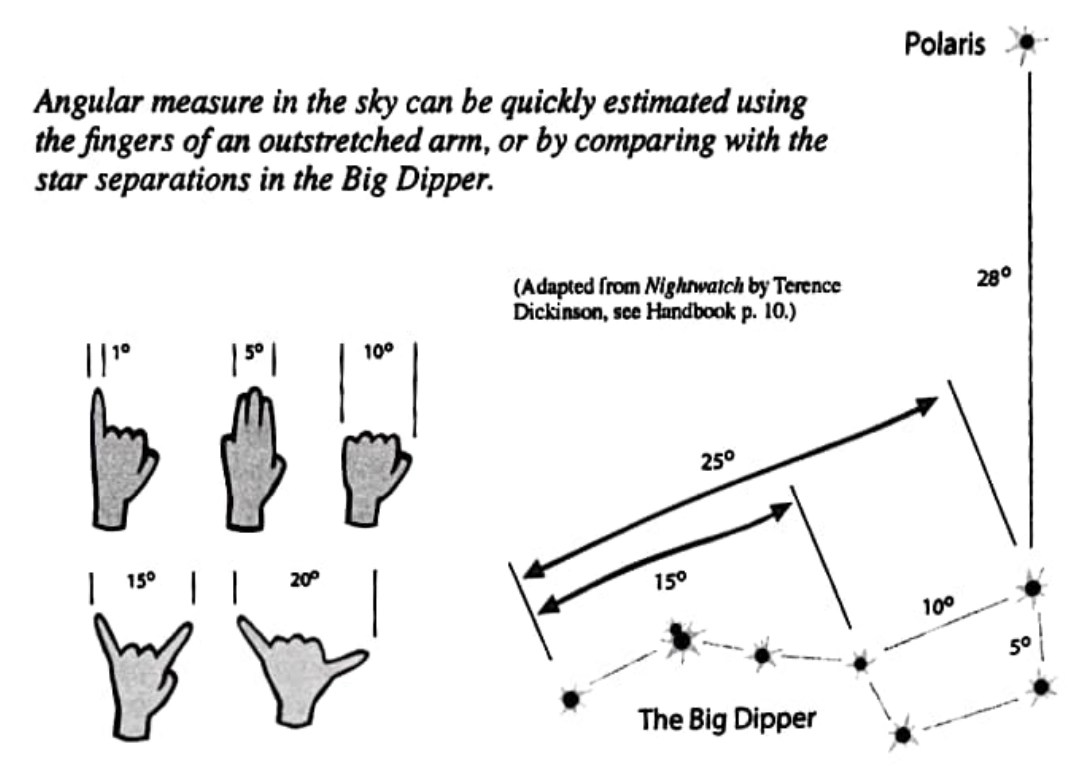
An approximate idea of the measurements in degrees can be obtained from Figure 1. Other references are the measurements of the Sun and Moon, both approximately 0.5° (which is why we have total solar eclipses).
Since they cannot be seen ‘at a glance’ because they are not very bright, we do not realize that some cosmological objects are actually ‘large’ in the sky.


Figure 1 – Easy reference for measuring angles in the sky (image credit: Nightwatch, Terence Dickinson)


For example:
– the Andromeda galaxy (Figure 2) measures about 3° x 1° (so it is 6 times the size of the Moon)


Figure 2 – Andromeda galaxy (image credit: Westend61 via Getty Images)


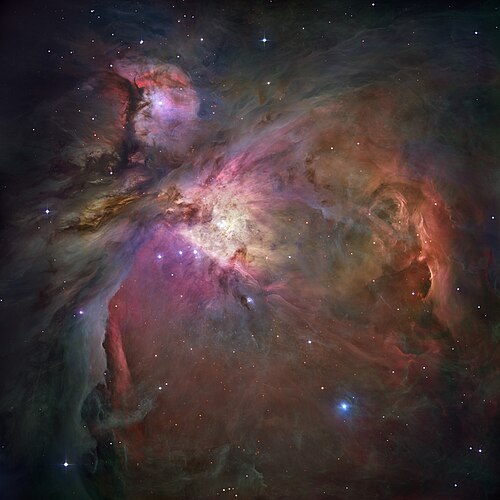
– the Orion Nebula (Figure 3, the star-forming region closest to us in our galaxy, about 1350 light-years away) measures about 1° x 1° (i.e., twice the size of the Moon)


Figure 3 – Orion Nebula (image credit: NASA/ESA’s Hubble Space Telescope)


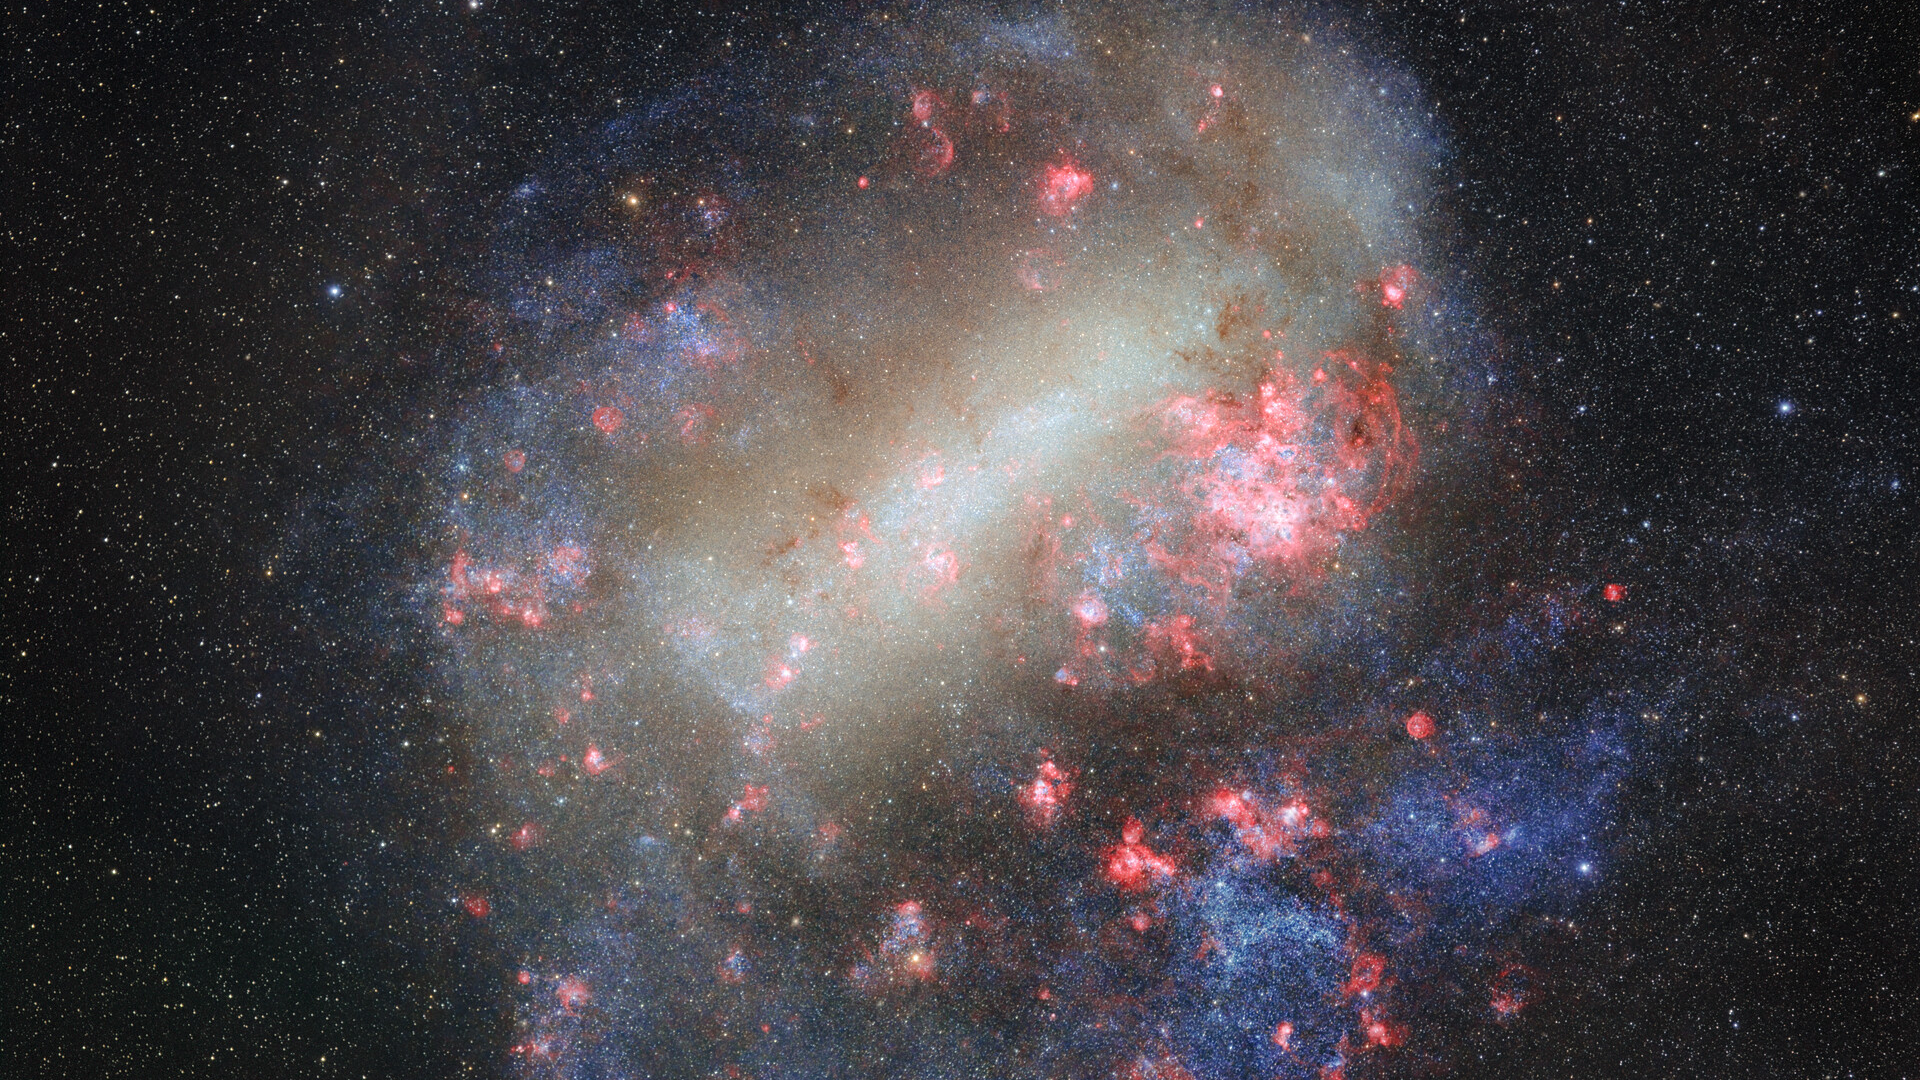
– The Large Magellanic Cloud (Figure 4, visible in the southern hemisphere) measures approximately 11° x 9° (i.e., it is 22 times wider than the Moon).


Figure 4 – Large Magellanic Cloud (image credit: Spitzer Space Telescope by NASA)

LMC


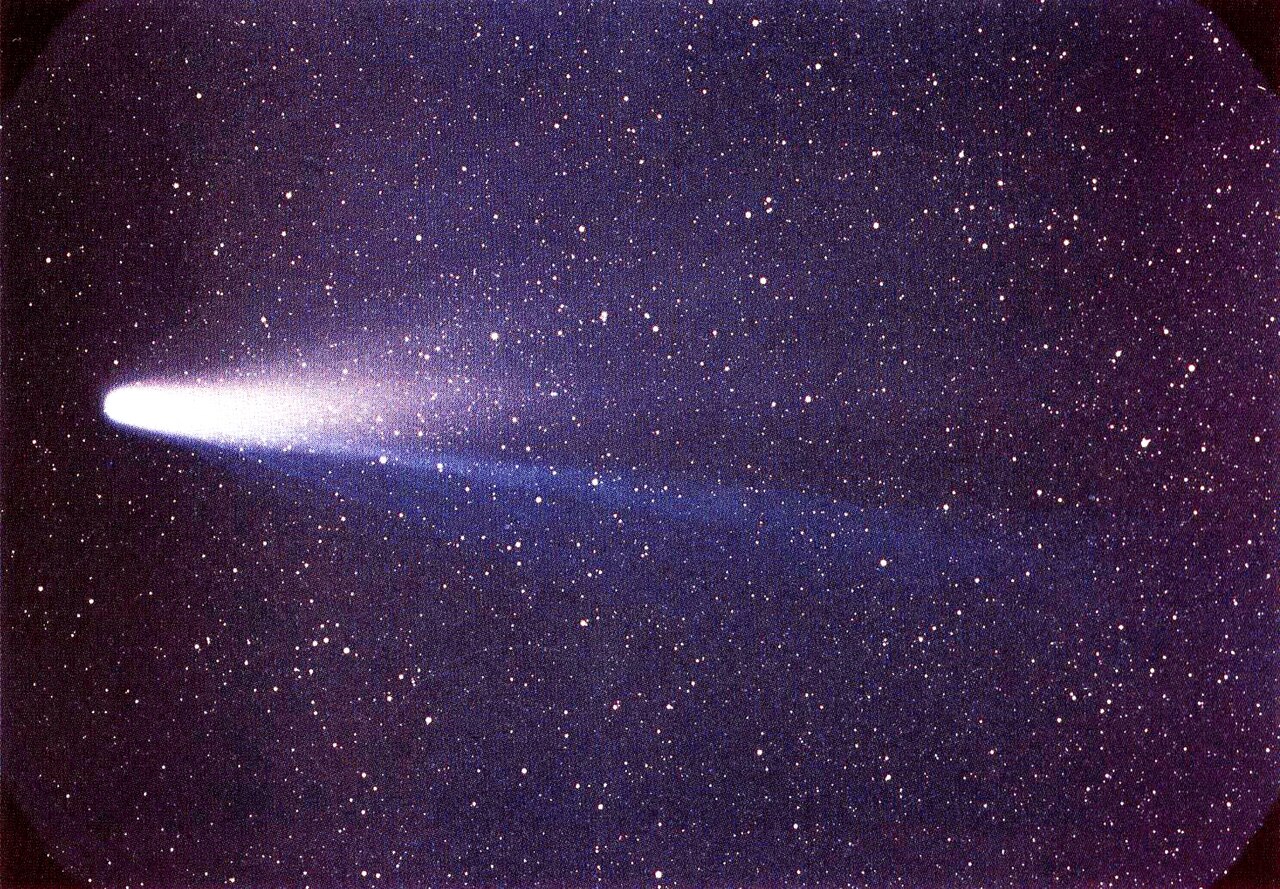
– Halley’s Comet (Figure 5), which passed by in 1986 (and will pass by again in 2061), measured a maximum of 15° (i.e., 30 times the width of the Moon).


Figure 5 – Halley’s Comet (image credit: W. Liller, Easter Island, part of the International Halley Watch IHW)


For comparison with the nearby planets in our solar system:
– Jupiter (whose diameter is about 11 times that of Earth) can reach a maximum of 50″ (or only 1/36 of the width of the Moon)
– Saturn (whose diameter is about 9.5 times that of Earth) can reach a maximum of 20″.


Credits: Teaching material for Spherical and Practical Astronomy course, Prof. Enrico Maria Corsini (University of Padua, Italy)

please, rate this post

Chandrasekhar dynamical friction formula

Brief analysis of Chandrasekhar’s formula on dynamic friction in the general case of galactic encounters in the study of Galactic Dynamics.

Spoiler: we get a result for the dynamical friction timescale which means that in a time span of a few Gyr, for instance with the values of our assumptions applied to the Milky Way, the orbit of a massive satellite has substantially reduced, while the orbit of lower mass satellites (such as globular clusters) has not been significantly affected by dynamic friction.

pdf  Brussi 2026_Chandrasekhar dynamical friction formula


please, rate this post

Note for laymen – what is the dark matter?

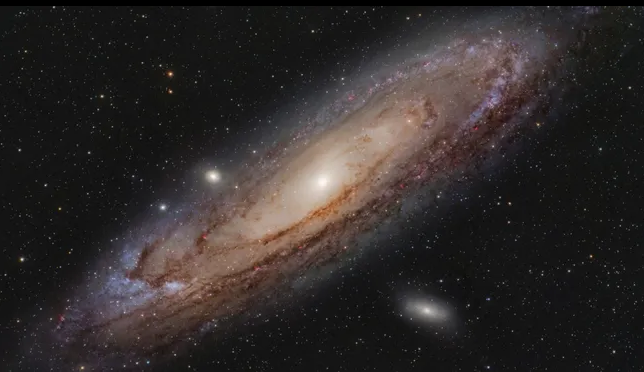
Let’s consider a disc galaxy with billions of stars forming the disc, which rotates (the Andromeda galaxy in the photo, to give a well-known example). We can consider for each of these stars that the centripetal acceleration
[1]    a’ = v²/R
is equal to the gravitational acceleration
[2]    a” = G M/R²
therefore from  [1] = [2]  we obtain:
[3]    v = √(G M/R)
where  v  is the local velocity of the source considered,  R  is its distance from the galactic center,  G  is the gravitational constant,  M  is the total mass contained within the radius  R  (which determines the gravitational attraction).
Measuring the rotational velocities of galaxies is relatively easy, if they are not seen face on, and it is generally observed that throughout the disk the rotational velocities of the sources (stars but also gas clouds) are almost constant. Therefore, from relation  [3]  it follows that the mass  M  must increase in proportion to the radius  R , since  G  is a constant. Indeed, the mass contained within the radius  R  increases as  R  increases, but what is observed is not sufficient to justify the constant value of  v . These considerations leads to the hypothesis that there is a substance that is invisible and non-baryonic in nature (i.e., not made up of protons and neutrons, which are not detected) that manifests itself only through gravitational behavior, which is called dark matter.


Processed photograph of M31, Andromeda. It was not possible to obtain the author of this beautiful photograph.


Andromeda

please, rate this post